

Building Pallet Atlas: The Knowledge Graph for Supply Chains
 Vidhur Kumar, Tech Lead
Over the past year, we’ve onboarded many enterprise customers onto the Pallet platform, scaled volume with them, and expanded the use-cases we serve on the platform. This unlocked a massive dataset drawn from two sources:
- Agent actions: Deploying agents to do the work of humans in these enterprises gave us access to data that a human operator would receive and produced data that the operator would as they did their work.
- Organizational data: Building integrations with an enterprise’s data systems is essential to deploying AI that delivers outcomes. Those integrations let us write back into the systems to get work done, and they also opened up access to the organization’s own data.
What surprised us most was the sheer scale of data our customers had accumulated over many years but hadn’t harnessed effectively to expand their businesses. We realized that analyzing this data and deriving insights from it would mean continuously surfacing revenue expansion opportunities and risks to the current business. We built Pallet Atlas to service this need.
Architecture
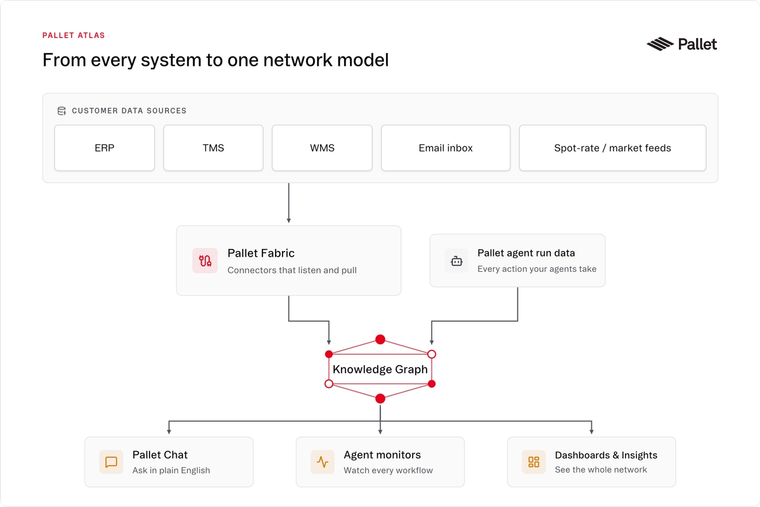
Atlas ingests data from two sources. External organizational data comes in through Pallet Fabric, our offering that connects any customer data source to Pallet’s systems. Each enterprise runs on a different combination of systems: a TMS for order management, a WMS for warehouse operations, an ERP for finance and reporting, and an email inbox where a significant portion of operational work happens. Fabric handles the entire synchronization process for all these data sources: the authentication, schema discovery, incremental syncs, checkpointing, data cleaning, etc.
The second source is Pallet's own agent run data. As our agents work inside these enterprises, they produce a structured record of everything they do: loads booked, carriers contacted, appointments scheduled. This data is already clean and first-party, and it flows directly into the graph.
Why a graph?
The questions our customers ask require connecting the dots across different business entities. “Which carriers are moving the most volume for a shipper they want to expand with? Which lanes are showing capacity tightness relative to current rates? Which shippers have gone quiet over the past 30 days?” These questions require traversing (or ‘hopping’) multiple entity types and ‘understanding’ the connections between them.
A knowledge graph treats these connections as first-class citizens. Carriers, shippers, loads, and lanes are nodes. The relationships between them are edges with their own properties. Traversing from a shipper to their carriers to their active lanes to current spot rates is a natural graph query.
Once data is in the graph, Atlas exposes it in three ways:
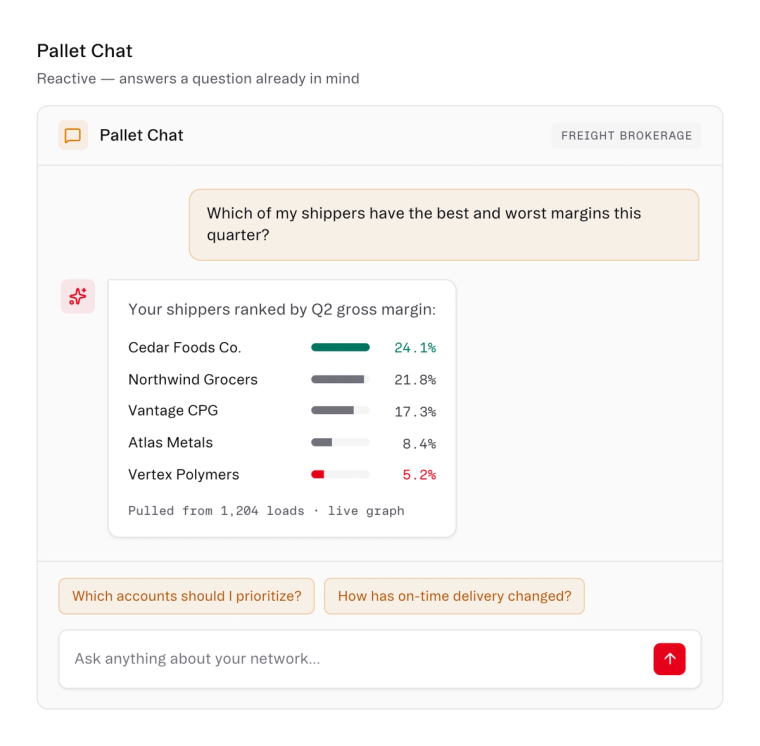
- Chat queries: A customer asks a question in plain English. The agent explores the graph schema, runs one or more targeted queries, and synthesizes a response.
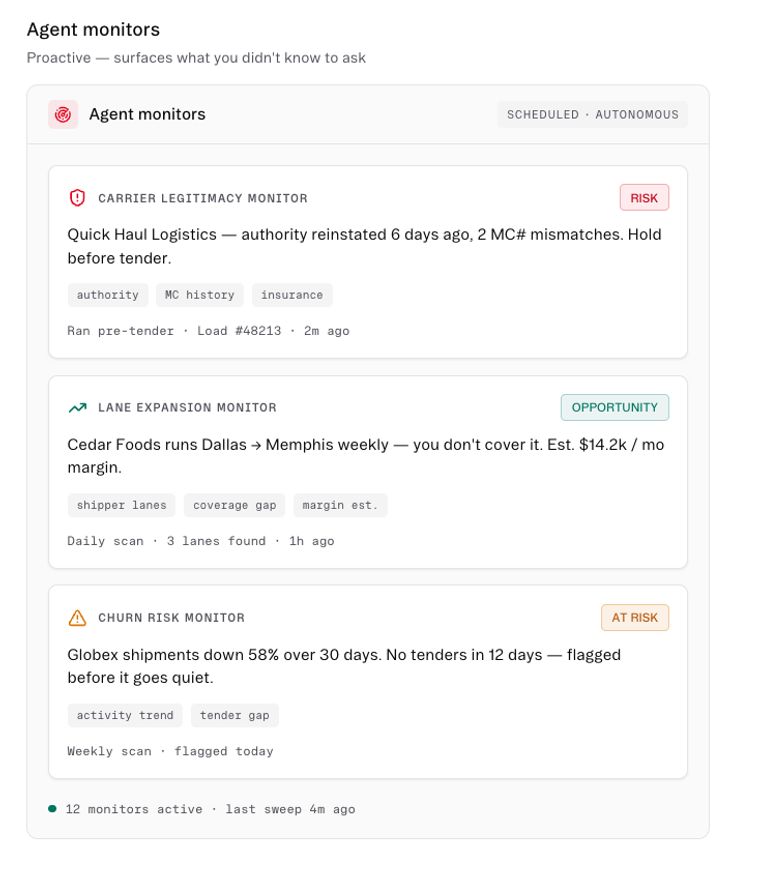
- Agent monitors: Customers set up monitors that query the graph on a schedule and surface opportunities or risks automatically. Common examples include identifying lane expansion opportunities with a shipper, validating carrier legitimacy before tendering a load, and detecting early churn signals.
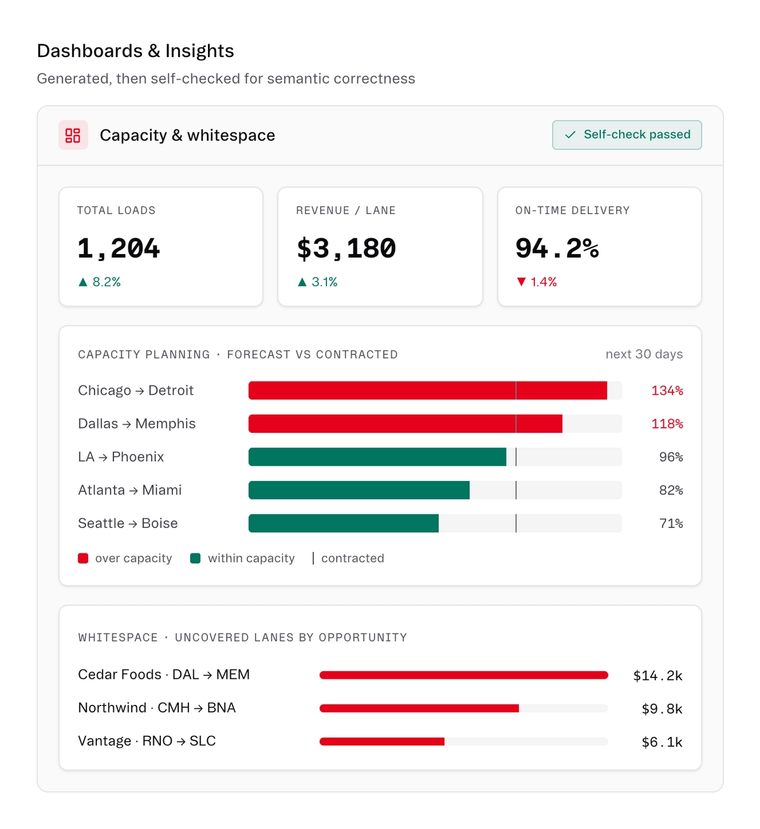
- Dashboards and Insights: For customers who want key metrics visible at a glance, Atlas generates dashboards with KPIs, charts, and heatmaps that pull live from the graph.
Ingestion: Turning messy, disparate data into an effective knowledge graph
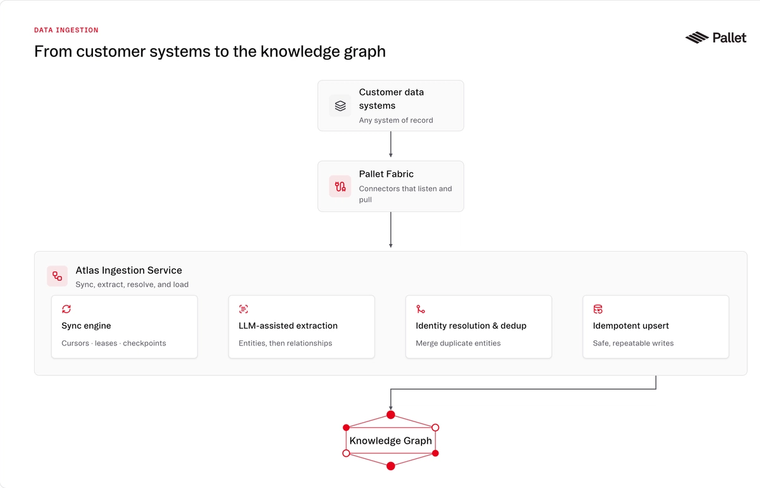
Before we could ingest a single record, we needed to answer a foundational question: what does the graph actually look like? The schema can't be arbitrary. It needs to be structured enough to support reliable querying across all customers, but flexible enough to capture what makes each customer's business different.
The ontology
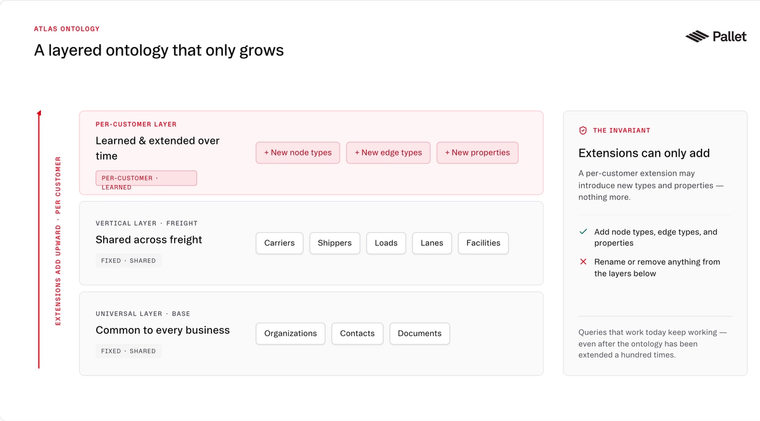
We model the graph using a layered ontology system. At the base is a universal layer that defines concepts common across all businesses: organizations, contacts, documents. On top of that sits a vertical layer specific to freight: carriers, shippers, loads, lanes, facilities. These two layers are fixed and shared across all customers. The third layer is per-customer and learned over time. As Atlas processes more of a customer's data, it identifies entity types and properties that don't exist in the base layers and extends the ontology for that customer specifically. A freight forwarder might have concepts that a domestic brokerage doesn't, and Atlas accommodates that without changing anything for other customers.
The constraint that holds this together is simple: extensions can only add. They can introduce new node types, new edge types, and new properties. They can’t rename or remove anything from the layers below them. This keeps the system stable as the ontology grows, and it means the base queries that work today will still work after the ontology has been extended a hundred times.
Building a reliable sync service for systems that weren’t built for it
Enterprise systems are not designed for clean programmatic access. TMS vendors have inconsistent pagination. ERPs export data in formats that vary by version and configuration. Email inboxes have no schema at all. Building a connector that syncs reliably from these systems required solving the following problems:
- Checkpointing: Each connector tracks its position using a composite cursor that captures exactly what it has and hasn't processed. If a sync is interrupted, the next run picks up from the same point rather than starting over or skipping records. Having a reliable cursor abstraction allows us to overcome the inconsistent pagination practices that we see in the customer data systems.
- Handling Time/Resource Limits: The systems that we are syncing data from have varying request timeouts/limits. Some of them are so antiquated that we may not even receive a clear indication that we hit a rate limit or timeout (simply a
500error)! The sync service is able to express a custom error policy for each data system, which allows us to appropriately deal with errors from the system and complete syncs. - Keeping entities current: It is always possible that records that were synced in a previous run continue to change in the source system after the cursor has moved past them. A load status, a carrier's compliance record, a shipper's contact information: these can all be updated in the source at any point. On each sync run, we reexamine records modified within a trailing lookback window, regardless of where the main cursor currently sits. This means recently updated records get reprocessed and the graph stays accurate, rather than reflecting the state of the source system only at the moment each record was first ingested.
Constructing the Knowledge Graph
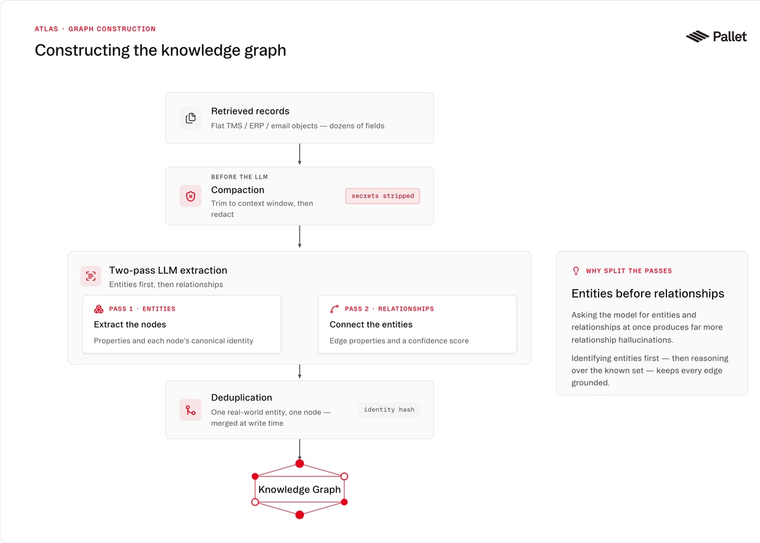
Once we’ve retrieved the records, we need to parse them and convert them into nodes/edges for the graph. A load record from a TMS is a flat object with dozens of fields. A graph node for that load has a defined set of properties, relationships to carriers and shippers, and a consistent identity that lets it be matched against the same load if it arrives from a different source.
We use a two-pass LLM extraction process. The first pass extracts entities: the nodes, their properties, and each node’s canonical identity. The second pass extracts relationships: how are those entities connected, with what properties on the edges, and with what confidence. Splitting the passes is deliberate. Asking an LLM to extract entities and relationships simultaneously produces significantly more relationship hallucinations than doing entities first and then asking the model to reason about connections between already-identified entities.
Before any record reaches the LLM, it goes through a compaction step. Large records are trimmed to fit within context limits. More importantly, secrets are stripped: API credentials, bearer tokens, private keys, and anything matching common credential patterns are redacted before the payload is considered ready for the LLM.
The final problem is deduplication. The same real-world entity often arrives from multiple source systems. A carrier that appears in a TMS, an ERP, and an email thread needs to resolve to a single node in the graph, not three. We compute a deterministic identity hash for each extracted entity based on its normalized properties, and use that hash to merge duplicates at write time rather than accumulating them.
Interaction: Using the knowledge graph to surface opportunities and risks
The query layer
The three interaction modes look different on the surface, but they share a common query layer underneath. Every request that reaches Atlas, whether from a chat query, a scheduled monitor, or a dashboard, is compiled through a query intermediate representation (IR): a language-neutral description of what data is needed and how it should be structured, before Atlas executes it against the knowledge graph.
The reason for this abstraction is straightforward: without it, each interaction mode would need to understand the graph's structure directly (which is an implementation detail), and any change to how the graph is queried would need to be made in three places. The IR provides a single interface that all three modes write to, and a single layer where query correctness and tenant isolation can be enforced before any query runs.
Interaction Modalities
Pallet Chat
When a customer asks a question, it triggers a Pallet Agent. The agent explores the graph schema, determines what queries are needed, runs them, and synthesizes a response. The agent understands what data exists before it attempts to answer, which prevents the common failure mode of confidently answering a question using data that isn't there.
Agent monitors
Agent monitors are architecturally different from chat queries. They are scheduled, autonomous, and designed to make a single decision: is there a risk or opportunity worth surfacing?
The agent queries the graph, synthesizes what it finds, and decides whether to generate an alert. No human is in the loop until after that decision is made. Common monitors include identifying lane expansion opportunities with a shipper, validating carrier legitimacy before tendering a load, and detecting early churn signals based on recent activity patterns.
The key difference from chat is intent. A chat query is reactive: a customer already has a question in mind. A monitor is proactive: it surfaces something the customer may not have known to ask about.
Dashboards and Insights
The Dashboard Builder is itself an agent that translates a customer's requirements into a set of charts, KPIs, and heatmaps backed by live graph queries. Generating a correct dashboard is harder than it looks. Charts can appear right but be semantically wrong: mixing revenue and volume on the same axis, comparing time grains that don't align, or querying a segment that returns zero rows without a sensible fallback. Before any dashboard definition is finalized, we run a self-check pass that validates the semantic correctness of each component. A chart that fails gets revised before it reaches the customer.
Looking Ahead: A Compounding Data Flywheel
Atlas has allowed multiple customers of Pallet to unlock opportunities that would otherwise have been buried in their mountain of unstructured data. What we are most excited about with the product is that its usage generates even more data. Every agent run’s data flows into the graph, and querying the knowledge graph generates usage data that better helps understand what our customers prioritize and also where supply chain as an industry is headed.
We’ve barely scratched the surface of what is possible with AI in supply chain. If this kind of impact at global scale interests you, we’re actively hiring across all functions!